Traktomizer Audio Analyser
How It Works
Traktomizer’s proprietary audio analysis provides incredibly detailed context for the full range of audio features being measured by song suggestion algorithms like Spotify, Apple Music, Google Music, Pandora and a hundred more streaming music platforms.
Traktomizer also contains empirical truth-models of the top 150 music genres to which music recommendation platforms are calibrated.
In tandem these features allow Traktomizer to compare a song’s audio feature qualities against the same standard means and distributions required for effective music information retrieval (MIR), which was perfected by The Echo Nest (later acquired by Spotify for $100m) and quickly adopted by streaming music platforms, to accurately recommend and suggest music to over 4 billion personalised users’ playlists every day.
Throughout the music production cycle and more especially during the final stages of song production (mixing and premastering), Traktomizer predicts chart-worthiness and will identify the most critical tweaks, which are ranked in order of least amount of change for maximum potential gain in algorithmic like-ability and therefore, organically generated (passive) streams and (elected) plays.
With respect to the art and the artists’ expressive freedom and individuality, each audio feature identified by the program as significantly weak is highlighted for scrutiny, but modification is for the producers’ themselves.
The goal for Traktomizer is to focus the music-maker on critical audio features which show up as weak relative to the song’s genre and other similar songs which are currently or have previously charted. By strengthening those audio properties deemed essential for algorithms to accurately make song suggestions to listeners, the song becomes predisposed with qualities favoured for automatic selection and plays, compared with the increasing and inevitable probability that the song would otherwise be invisible, like a needle in a haystack, among 60 million contenders.
Traktomizer in Operation
written by music producer and creator of Traktomizer, Steve Freedom
OK so let’s say our song is nearly finished and we have a Premaster-mix on hand. Instead of sending this mix to the Mastering Studio as usual, we’ll let Traktomizer perform some audio analysis to identify opportunities for optimizations. So let’s begin…
1. Traktomizer wants to compare our song with the 16 best it can find in our chosen Genre. Traktomizer allows us to include more songs, but adding too many will lower the overall standard and we only want to test against the cream, the most charted, the most played, the most loved music in recorded history – so let’s name these 16 our ‘Benchmark Analysis Pool’.
<= to the left you can see the Project Settings Pallet (click the image to enlarge it). Notice the modifiable but default settings. We just need to a) choose a song from disk to analyze; b) enter a Benchmark song Title (a song of the same genre we think is the best yardstick for a great mix); c) enter the Artist's Name; d) click 'Traktomize‘
2. Traktomizer Audio Analysis begins and a Progress Viewport opens. The viewport presents us with ongoing activity so we can see what’s happening.
3. Traktomizer sets about its first order of business: Analyzing our song. Then using our benchmark song as the seed Traktomizer will identify 16 benchmark songs. Traktomizer probes the Spotify API in search of benchmark songs and retrieves their audio properties Traktomizer is particularly interested in danceability, acousticness, energy, liveness, loudness, speechiness, valence(mood), and duration. It takes Traktomizer only seconds to a few minutes (depending on your Internet connection speed) to probe, retrieve and compute all requisite audio vectors. Traktomizer will have also retrieved this week’s top 50 songs from Spotify and 7Digital in search of 5 currently charting songs in the same Genre as our benchmark song. And for each benchmark Artist, Traktomizer will identify their top ranking song. Within moments Traktomizer will have: a) retrieved the audio analysis for our song; b) retrieved the audio analysis for every benchmark song (from approx. 200 to 300 likely candidates) c) scrutinized this week’s 50 charting songs and possibly included and retrieved audio analysis for 5 more songs (currently charting and on-genre). Our final Analysis Pool should comprise our song (1) + the benchmark songs (17) + the charting songs (5) – these songs will be the very best, most recommended, most played, highest ranked songs in our Benchmark Artists’ Genre.
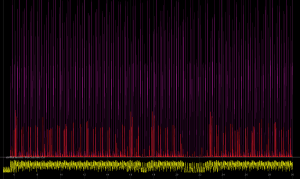
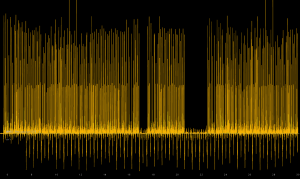
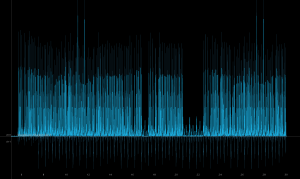
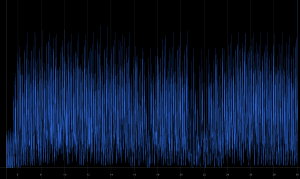
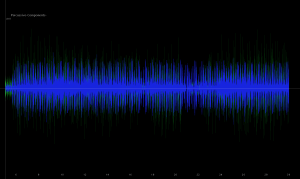
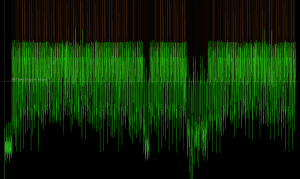
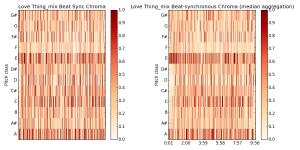
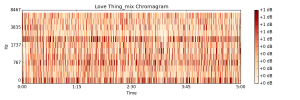
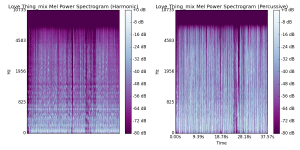
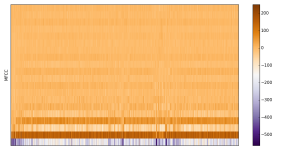
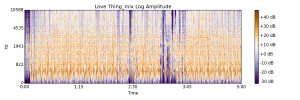
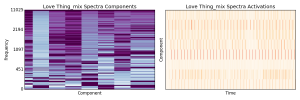
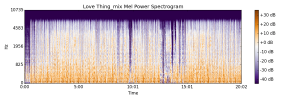
10. Traktomizer also generated 8 Open-GL charts and byte-array data-sets from its analysis. We can study these immersive, interactive views of our song, navigating our sound as one would play a 3D computer game. We can also export the OpenGL Charts to PNGs, at various scales.
11. Traktomizer produced 2 more PDF’s and saved them to our Documents folder. One of them is a copy of the Progress View Port trace which was being updated throughout this analysis task. The second PDF is a final summary report, which describes in detail how our song stacked up against all 22 benchmark songs. Much of the data contained in this report can be visualized on our Dashboard. We can use the Dashboard for a high-level overview, presented by various dials and summary charts. For a more granular and detailed look at how well our song performed, we would take a look at the Summary Report PDF which contains the individual values and totals for each audio vector. Additionally, the last portion of the report contains the updated song analysis results for our entire library, with our new song taken into account.
12. Traktomizer has determined our new song’s overall Chartability-Rating (see the Dashboard) and it’s weakest 3 audio properties (listed on the right side of the Dashboard.) It’s telling us that a) we should check these deficient areas and make appropriate changes if we think we can improve them, and b) making changes to these areas first is likely to achieve the maximum overall improvement possible (even if other areas were also found wanting attention).
13. Traktomizer sneaked in another process in search of all our benchmark song mp3 previews. It probably found previews for all the songs (but its not a given). A playlist was created for Traktomizer’s mp3 player. The playlist will be in the same order as our benchmark search. Clicking the topmost song in the playlist starts successive playback which will continue until we click the stop button.
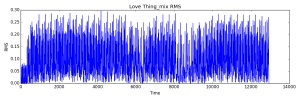
14. Dynamic Range, Peak Level and RMS are also calculated: On the left and right side of our Dashboard, and recorded in Summary PDF Reports, are highly accurate readings detailing our songs dynamics and loudness characteristics. These were calculated locally by Traktomizer’s built-in routines. See the User Manual for a detailed description about how they should be interpreted.
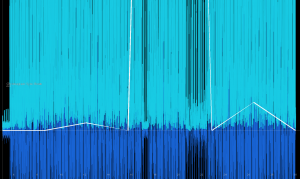
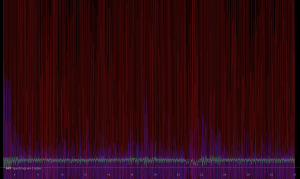
15. Taking a quick visit to the Open-GL view we click the STFT Magphase Component Button-Icon on the View Title-bar. Traktomizer presents a render to show whether our song has demonstrated a continuous increase in loudness from beginning to end. Recent research seems to show that charting songs display a tendency towards increasing loudness. 16. Traktomizer encoded a number of byte-array files on disk. They are prefixed with our new song’s name and used by Traktomizer to reproduce the Open-GL charts at lightning speed, rather than reanalysing the audio file every time we want to visualize it. Additionally, the byte-arrays contain beat-matching, pitch, melody and a variety of array-like decompositions which can be used for creating remixes and new compositions in other programs. Planned future releases will take more advantage of these files. For now we generate them for use with the Open-GL viewer. If we make changes to our song we can perform an Iteration Analysis to plot our previous audio properties alongside our new version. We can easily see differences between each iterations, and Traktomizer will automatically refresh our OpenGL byte-array files. Our Song is ‘Traktomized’!
Traktomizer has many more features such as Loudness Benchmarking, Social Media Tracking & Metrics Benchmarking, Iterations Analysis, Custom Styles and GUI Layouts and Song Database Management.
~ A Work-in-Progress Example ~
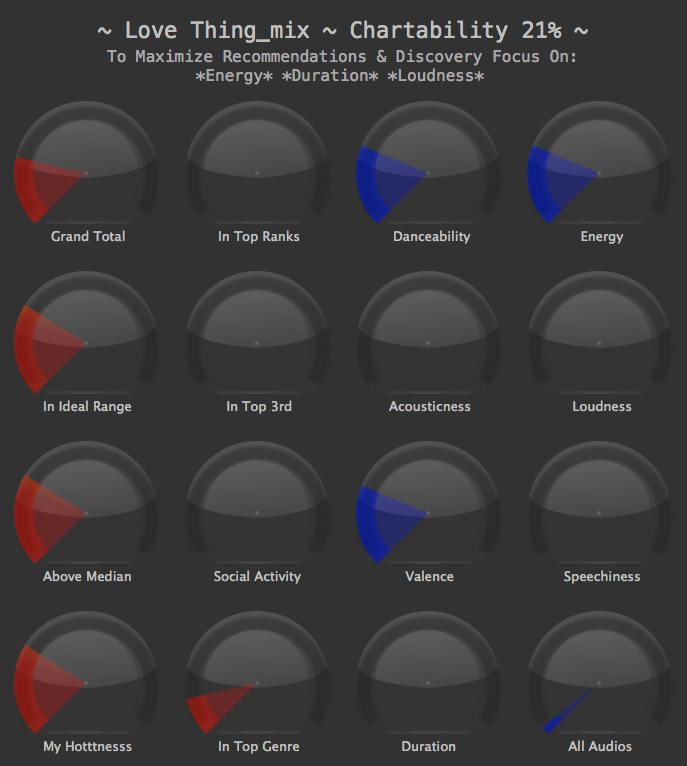
Traktomizer has determined my song ‘Love Thing’ will benefit from tweaks to:
*Energy is weak: Pool = 0.705 | Love Thing = 0.593
*Duration too long: Pool = 237.83 s | Love Thing = 300.53 s
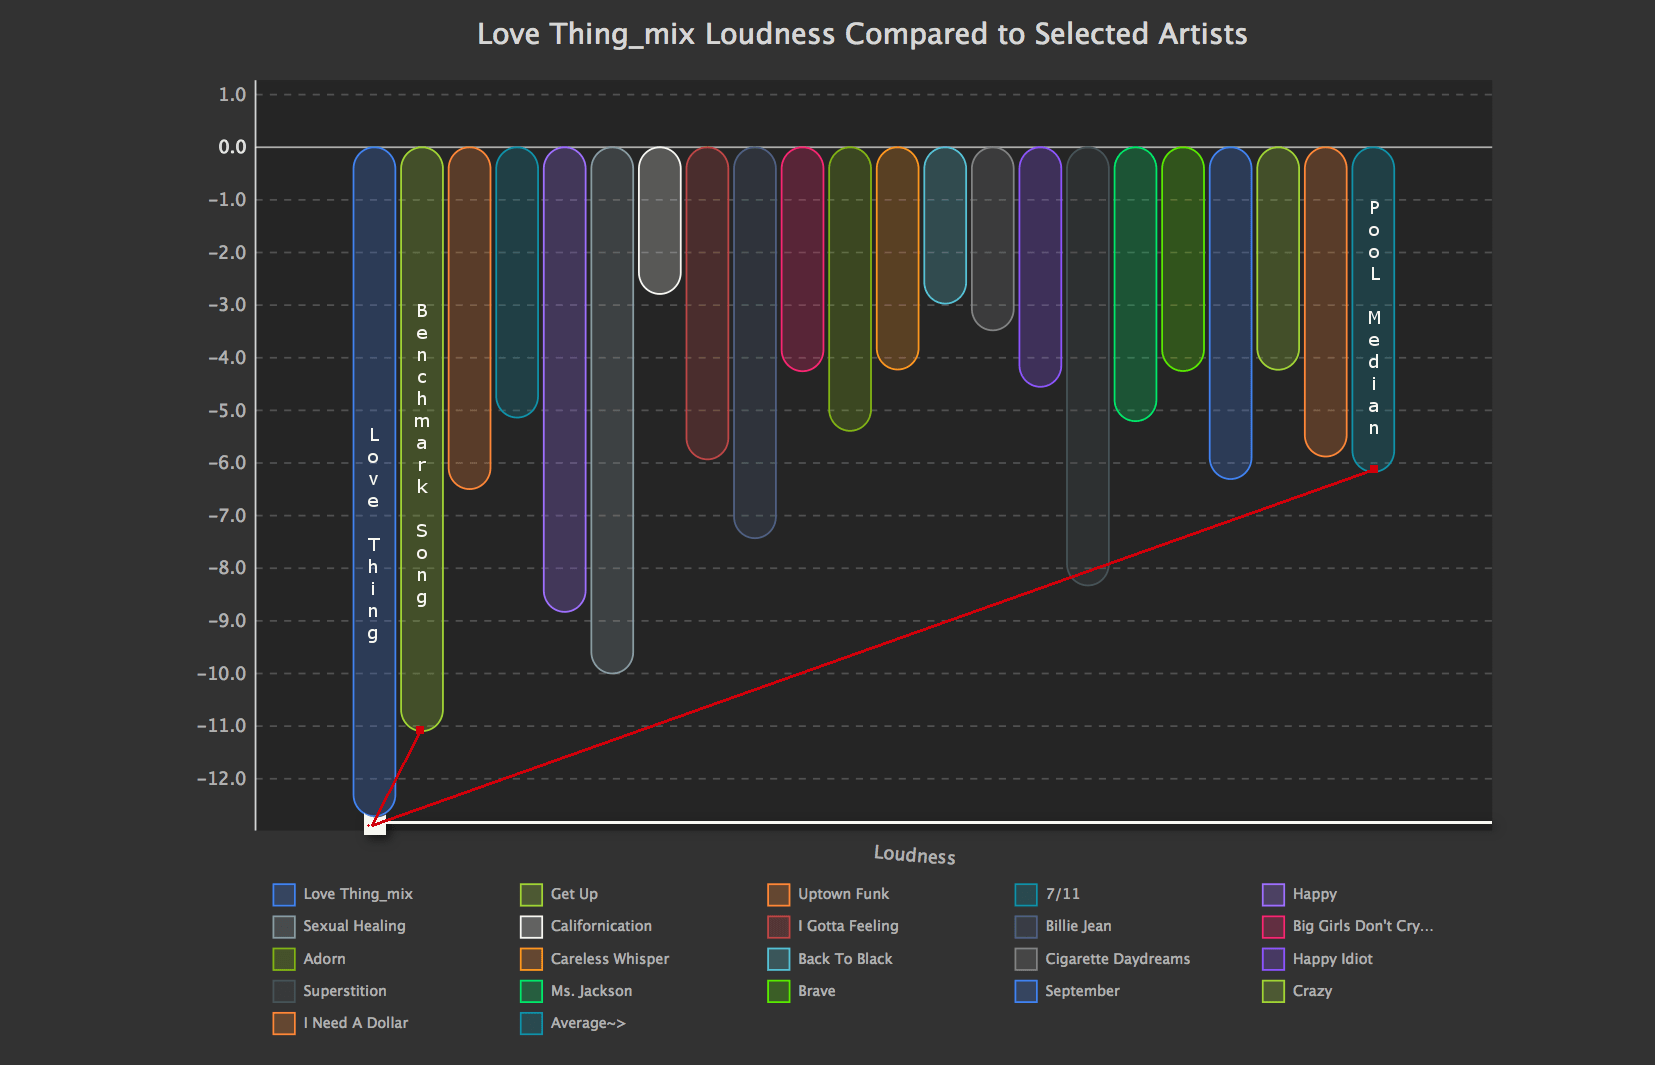
*Loudness very low: Pool = -5.8 dB | Love Thing = -12.7 dB
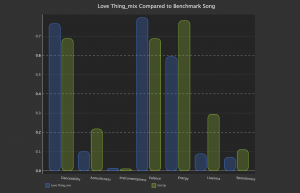
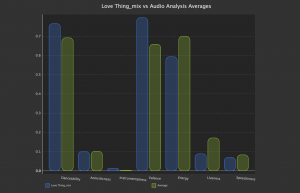
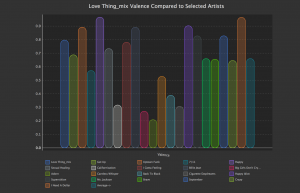
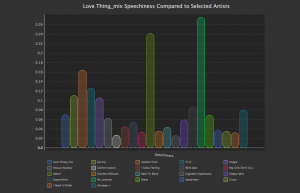
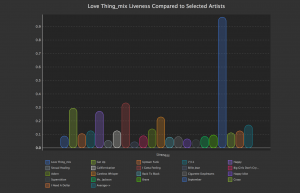
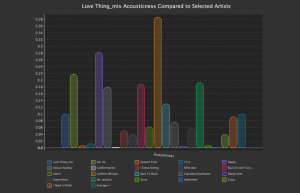
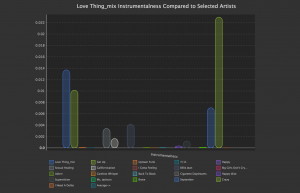
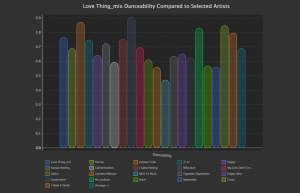
I checked the individual Audio Property Charts and the Traktomizer Dashboard. (see below)
The Dashboard (below-left) confirmed tweaks to *Energy*, *Loudness* and *Duration* – displayed below the Chartability Rating, which was 21%.
I added a little Compression and EQ (between 500hz to 2.4khz) and after Iteration Analysis the updated Dashboard (below-right) reflects an improvement:
My Chartability Rating Doubled from 21% to 42%
The example revealed the dramatic impact of Energy, Loudness and Duration other Audio Properties remained largely unchanged


